Chapter 3: Deep dive: Old Kent Road
39This chapter looks at one of London’s most challenging local areas when it comes to managing the impacts of freight and deliveries on air pollution. We have chosen the Old Kent Road since it is one of the worst in London for exposure to air pollution, and has been designated by the GLA as an “air quality focus area”. It also serves many, sometimes competing, functions:
- A high street used by local people for its grocery stores, pharmacists, schools, restaurants, takeaways, cafes, and religious spaces. It is also a popular shopping destination, with several “big box” stores such as B&Q. The road is also home to a hotel, as well as many businesses led by people from Latin American and African diasporas, making it a hub for several communities.
- A dense residential area where the population is more likely to be deprived and racialised. Residents have among the worst health outcomes in London. 40
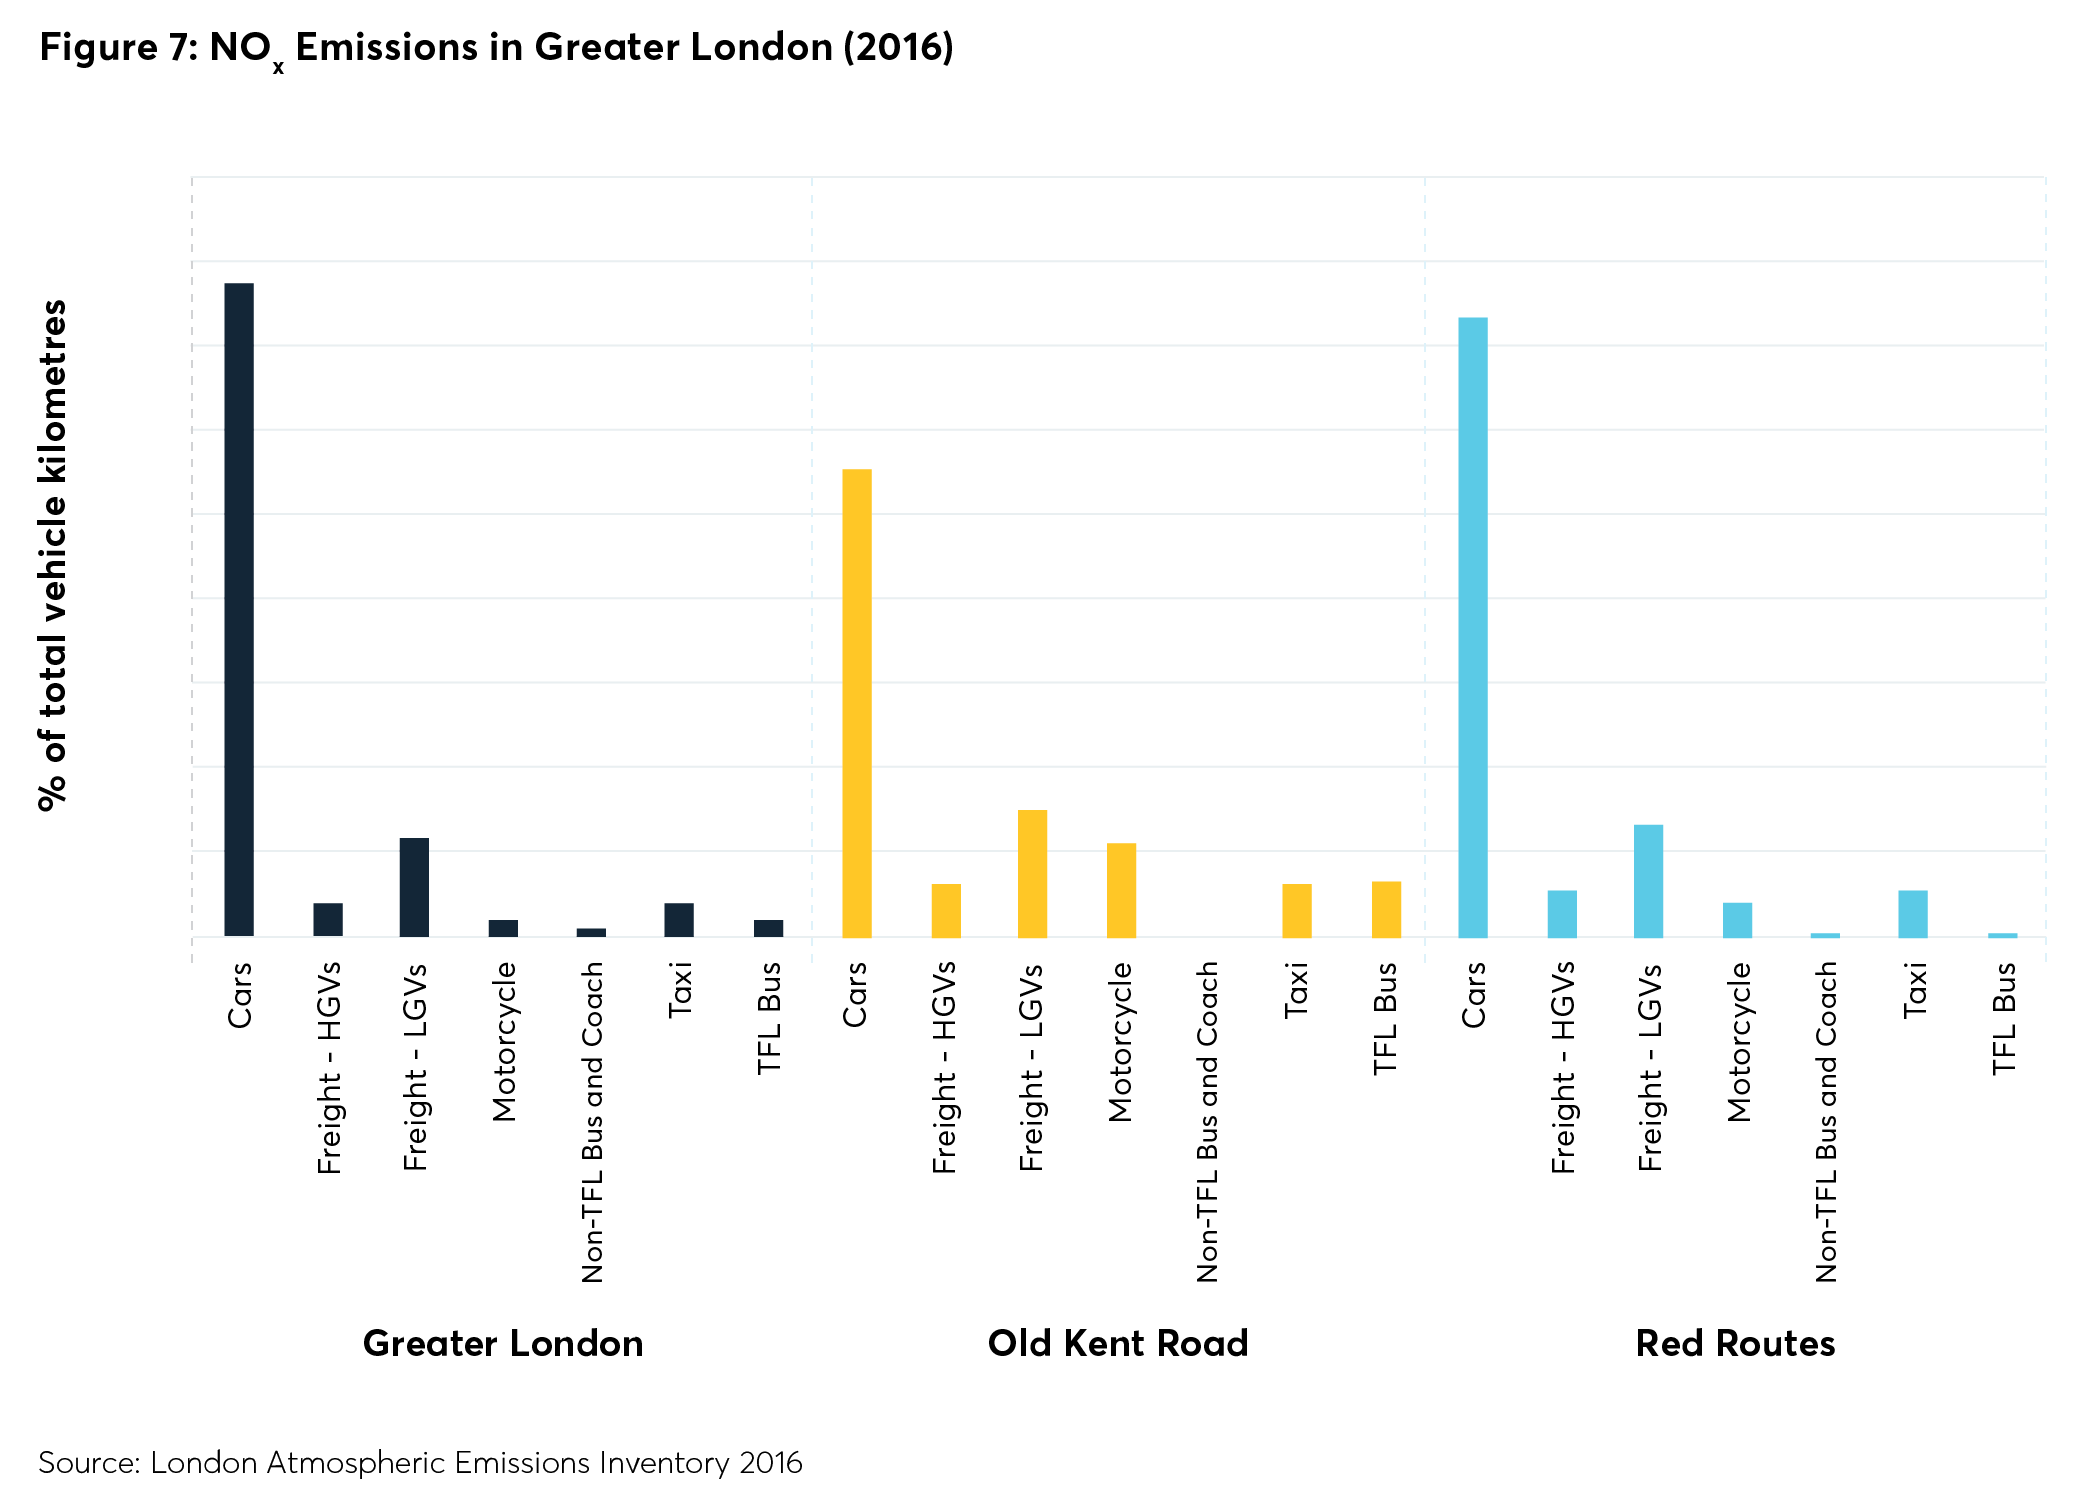
- A Red Route (part of the TfL-managed Strategic Route Network) and a strategic freight corridor into central and southeast London, used by a wide range of vehicles. Freight and buses make up a greater proportion of traffic on the Old Kent Road than they do on average across London (see Figure 2 below). In addition, 21 per cent of vehicle miles travelled on the Old Kent Road are by freight vehicles, compared to 15 per cent in Greater London and 18 per cent on Red Routes.
- A freight/deliveries hub and a prime industrial location. Local depots include carrier companies, a waste removal company, and many industrial occupiers.
Air pollution on the Old Kent Road
The following illustrations highlight the disproportionate impact of goods vehicles on air pollution, and why this is a particular challenge for key freight corridors like the Old Kent Road.

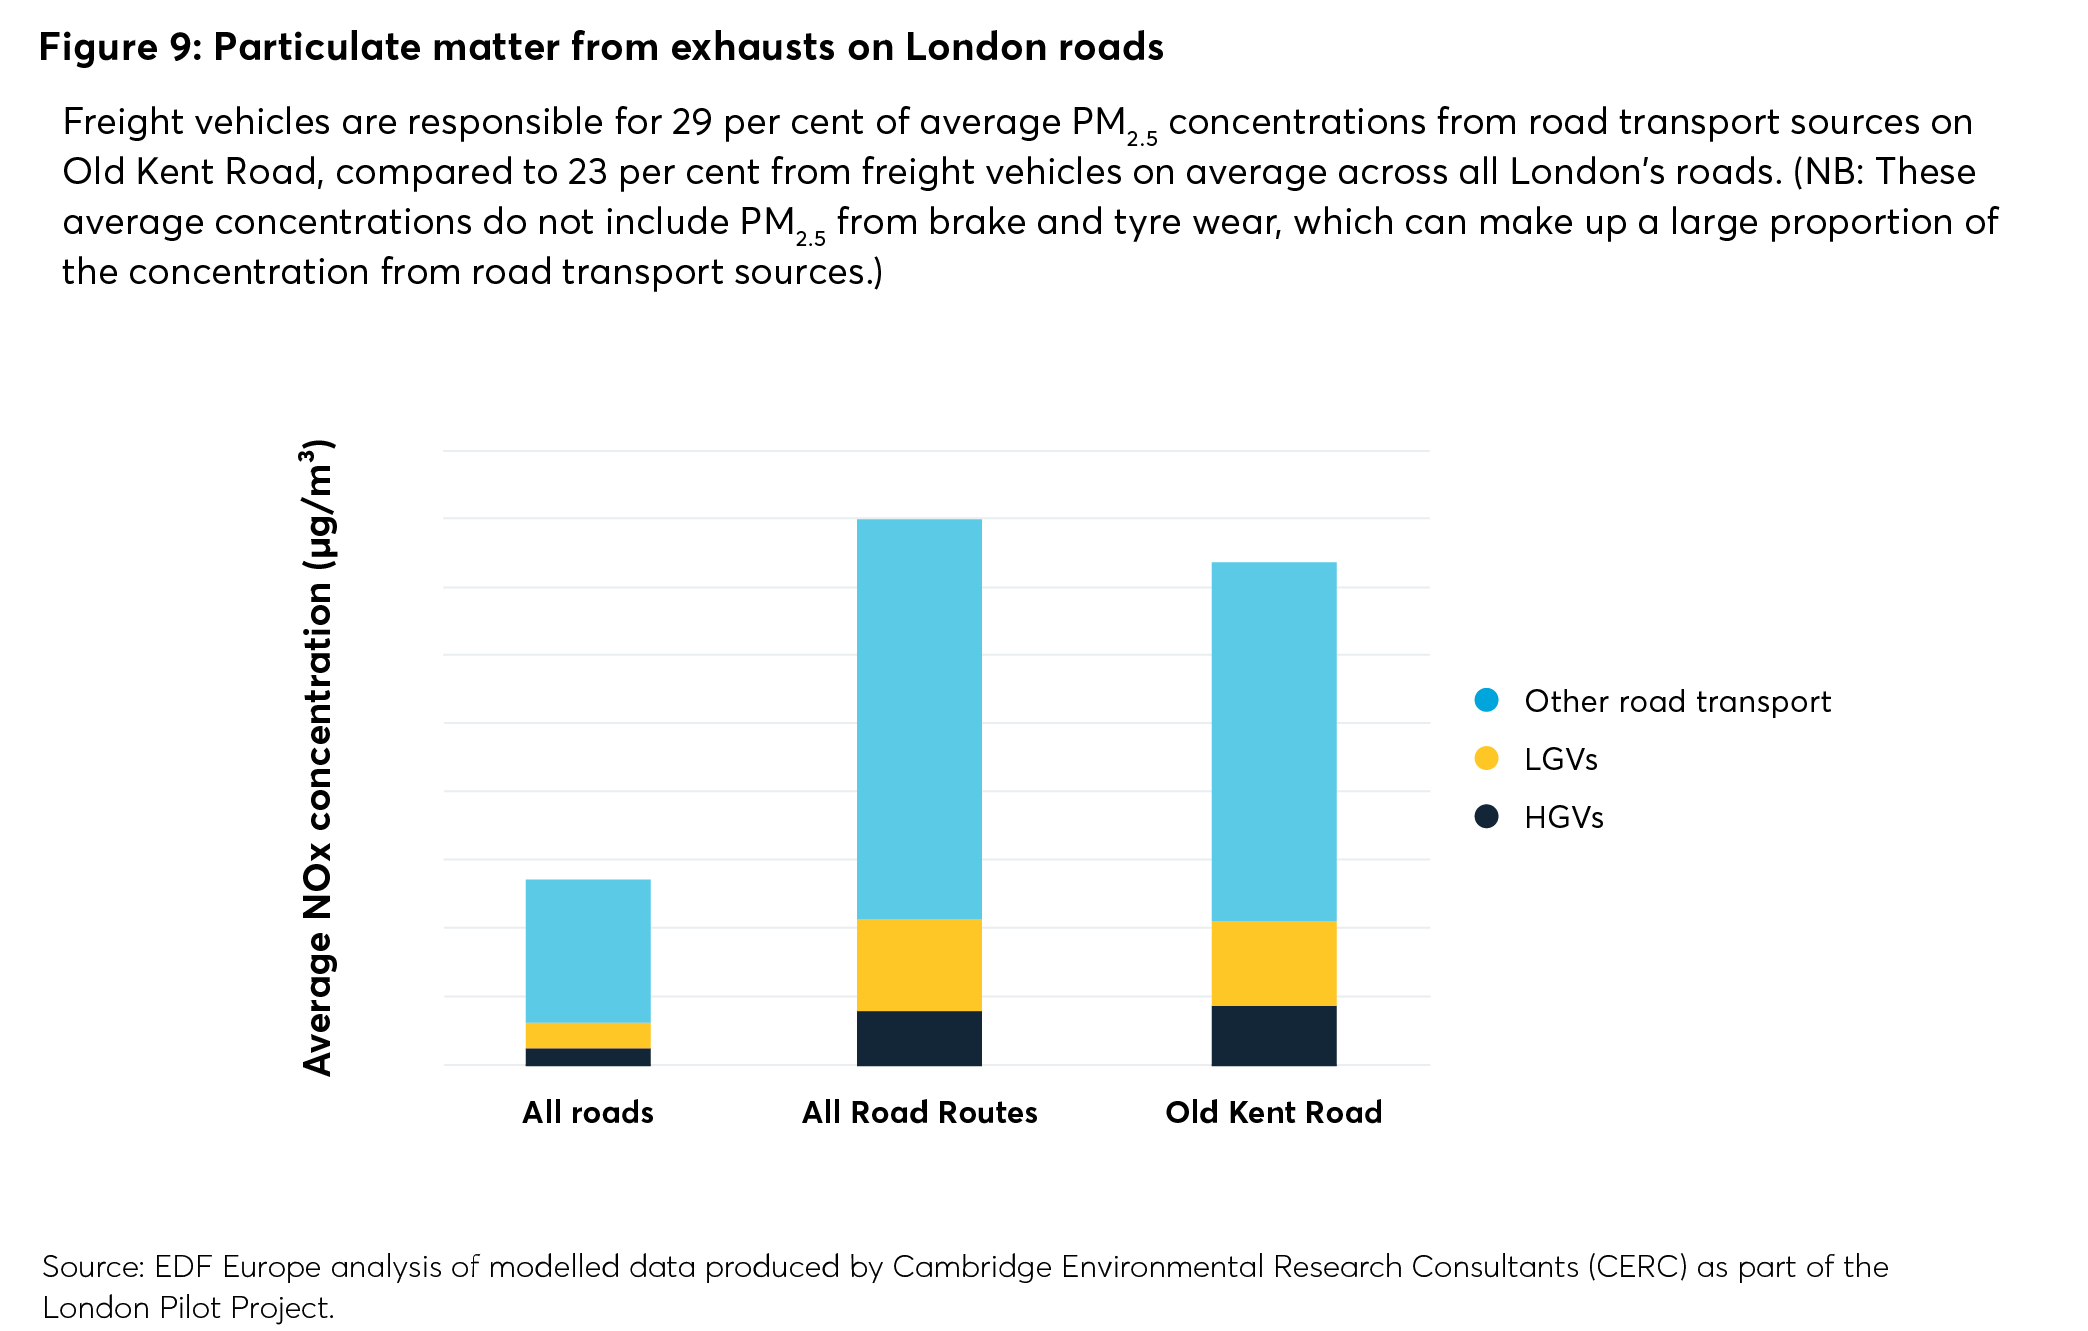
Figure 9: Particulate matter from exhausts on London roads
Freight vehicles are responsible for 29 per cent of average PM2.5 concentrations from road transport sources on Old Kent Road, compared to 23 per cent from freight vehicles on average across all London’s roads. (NB: These average concentrations do not include PM2.5 from brake and tyre wear, which can make up a large proportion of the concentration from road transport sources.)
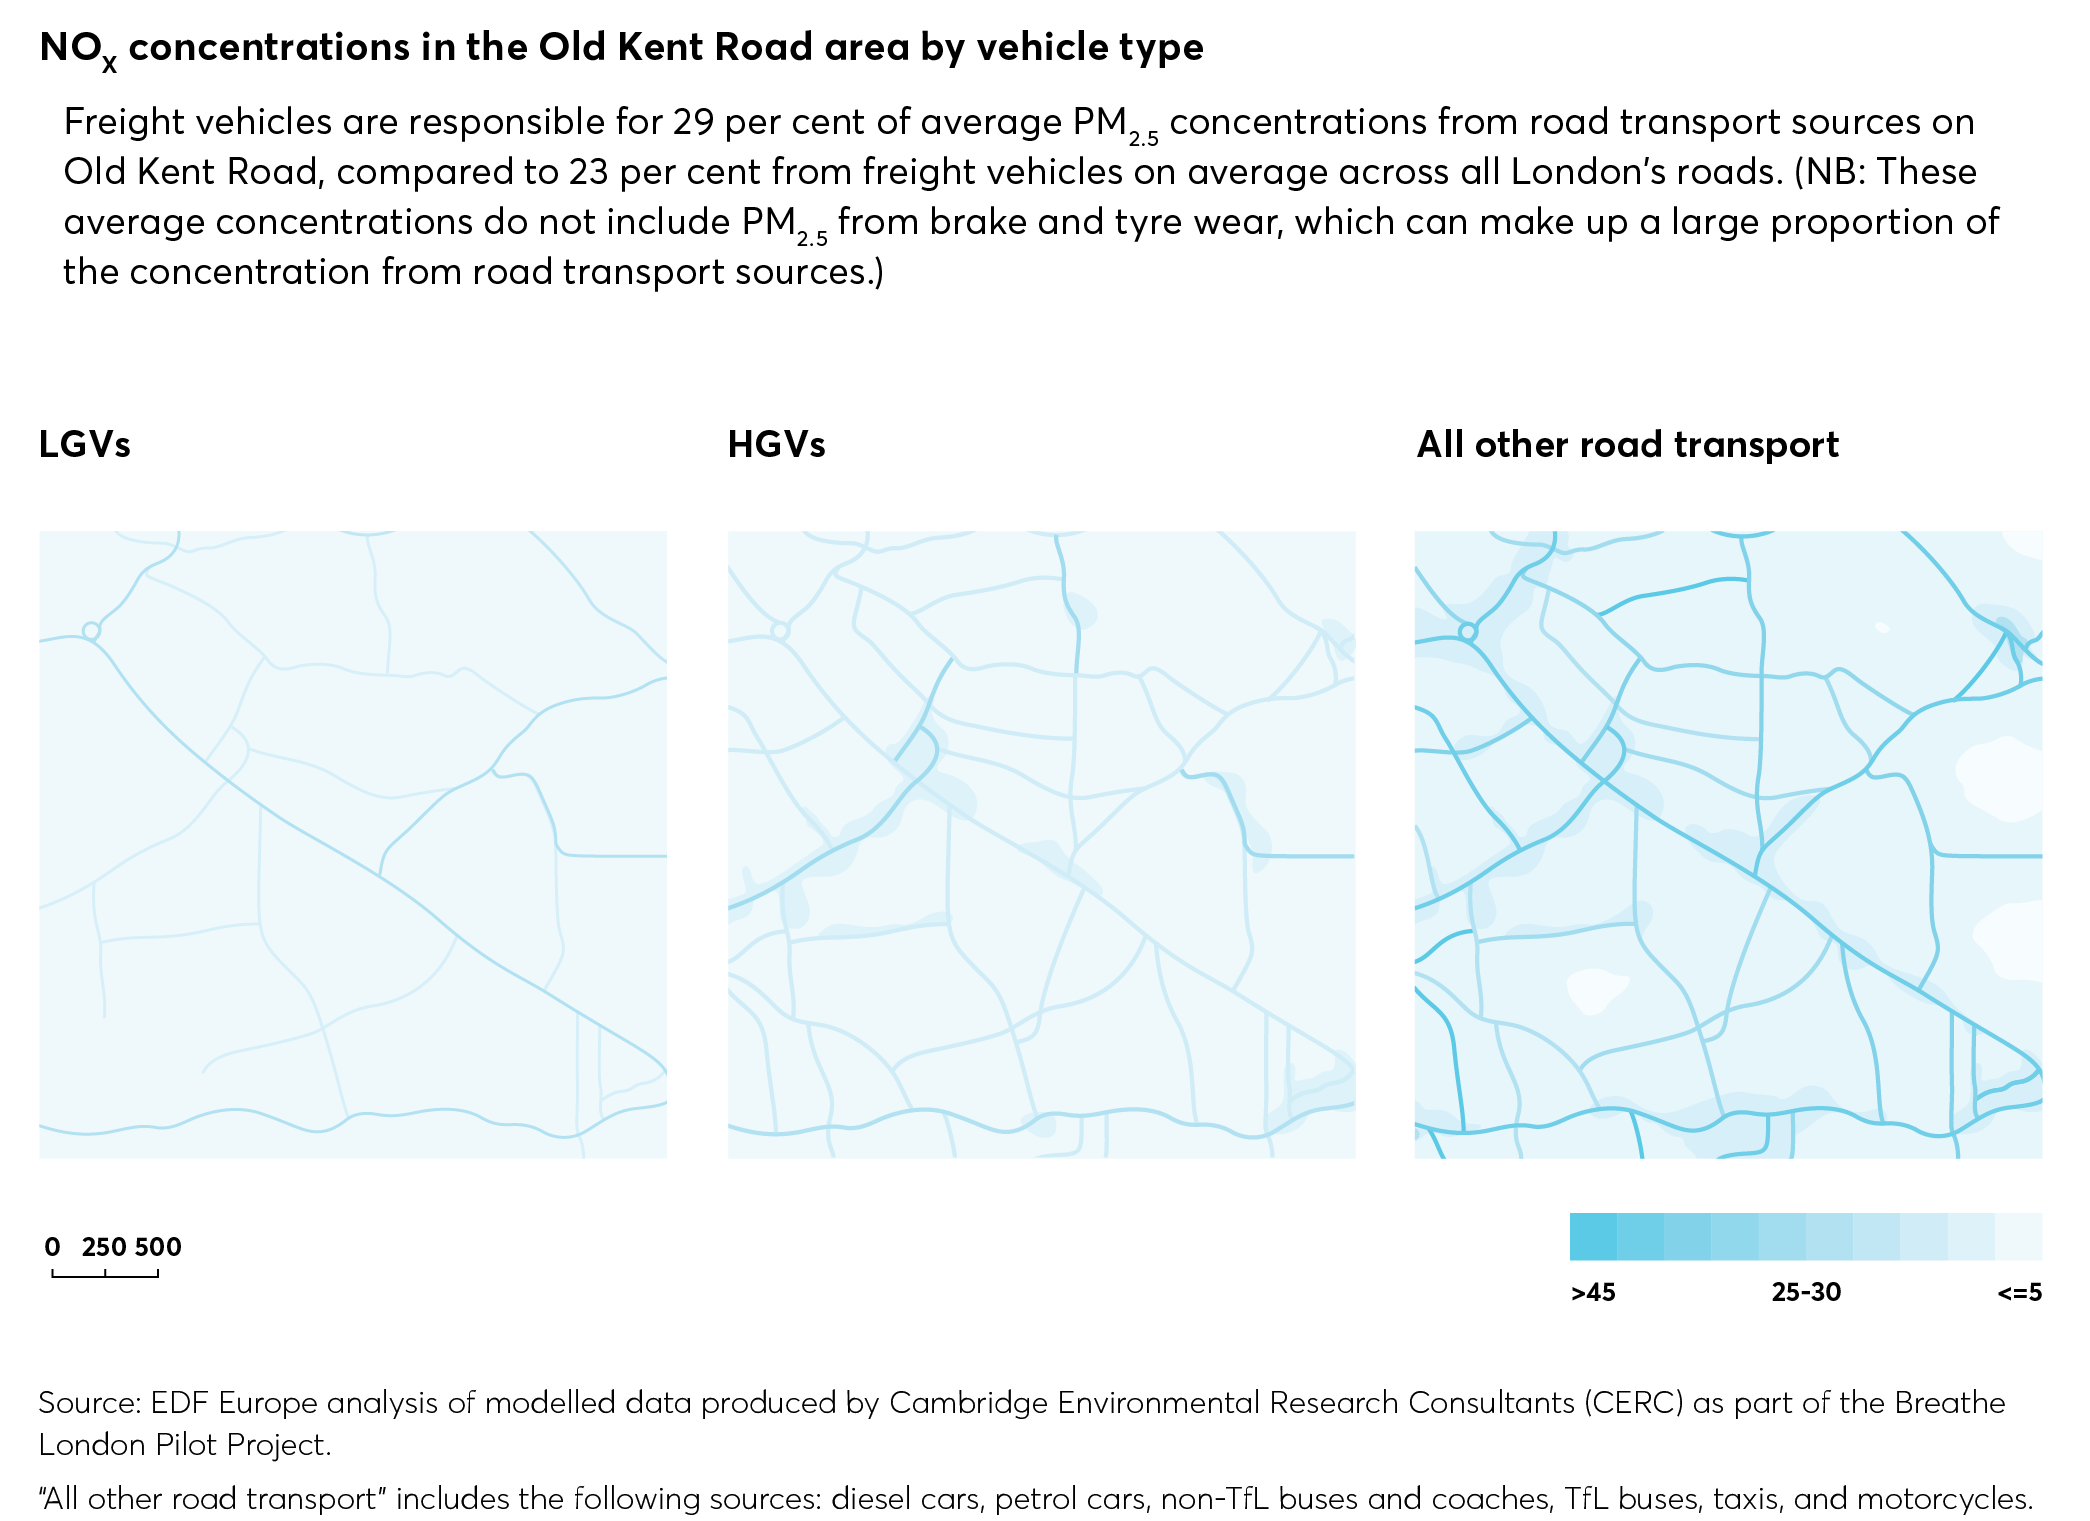
NOX concentrations in the Old Kent Road area by vehicle type
Freight vehicles are responsible for 29 per cent of average PM2.5 concentrations from road transport sources on Old Kent Road, compared to 23 per cent from freight vehicles on average across all London’s roads. (NB: These average concentrations do not include PM2.5 from brake and tyre wear, which can make up a large proportion of the concentration from road transport sources.)
Freight vehicle journeys
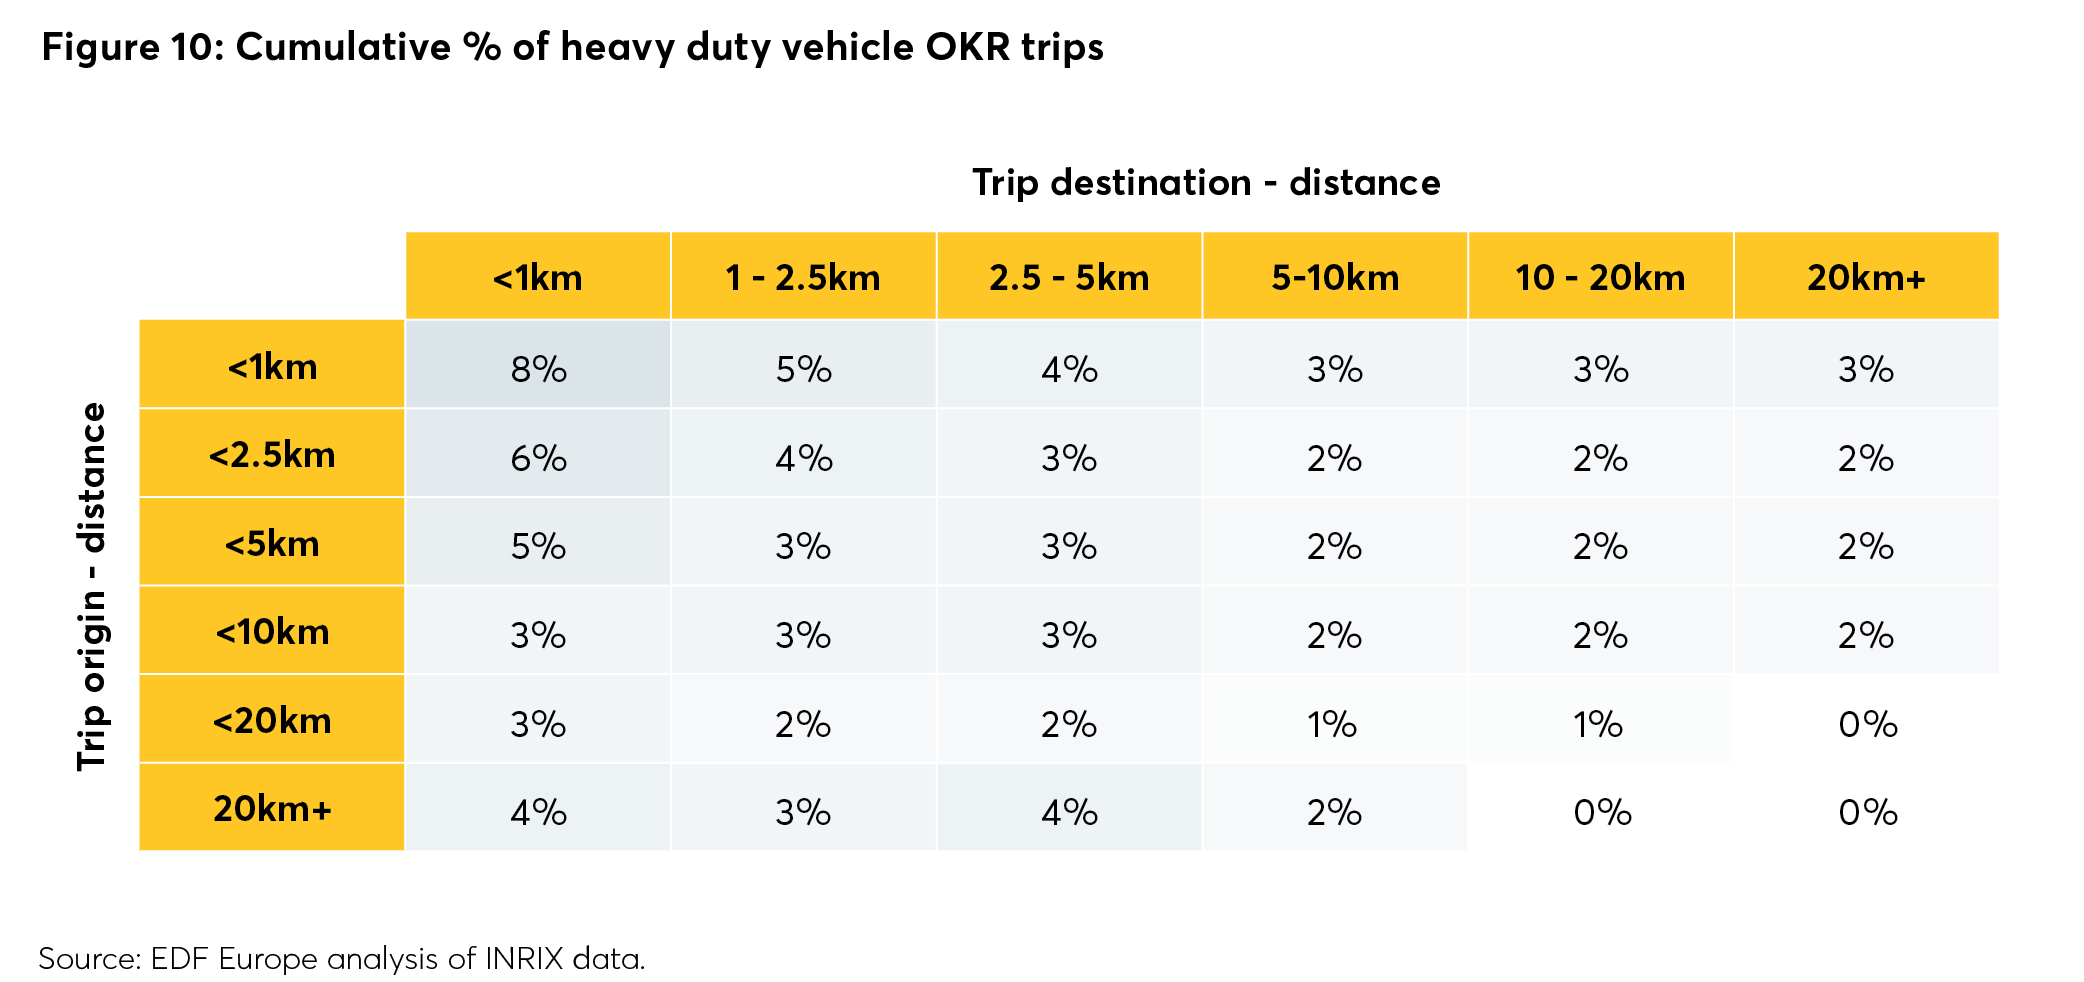
As set out in previous chapters, freight journeys are very diverse in terms of distance, purpose and vehicle type – and so different air pollution mitigation measures will work for different types of trips. Data analysis provided by the Environmental Defense Fund Europe offers information on heavy goods vehicles using the Old Kent Road from a sample of 7,100 trips made by goods vehicles on the Old Kent Road during the week of 9-15 September 2019. All trips used in this analysis were made by HGVs, which are estimated to make up 29 per cent of total miles travelled by freight vehicles on the Old Kent Road.
Patterns of demand
HGVs using the Old Kent Road show a mix of local and external trip generation. However, the majority were generated locally:
- 24 per cent of freight trips using the Old Kent Road started and finished locally – within 2.5km of the road.
- 49 per cent of freight trips using the Old Kent Road had either an origin or a destination within 1km of the road itself, and 73 per cent within 2.5km.
- 28 per cent of trips were passing through the area
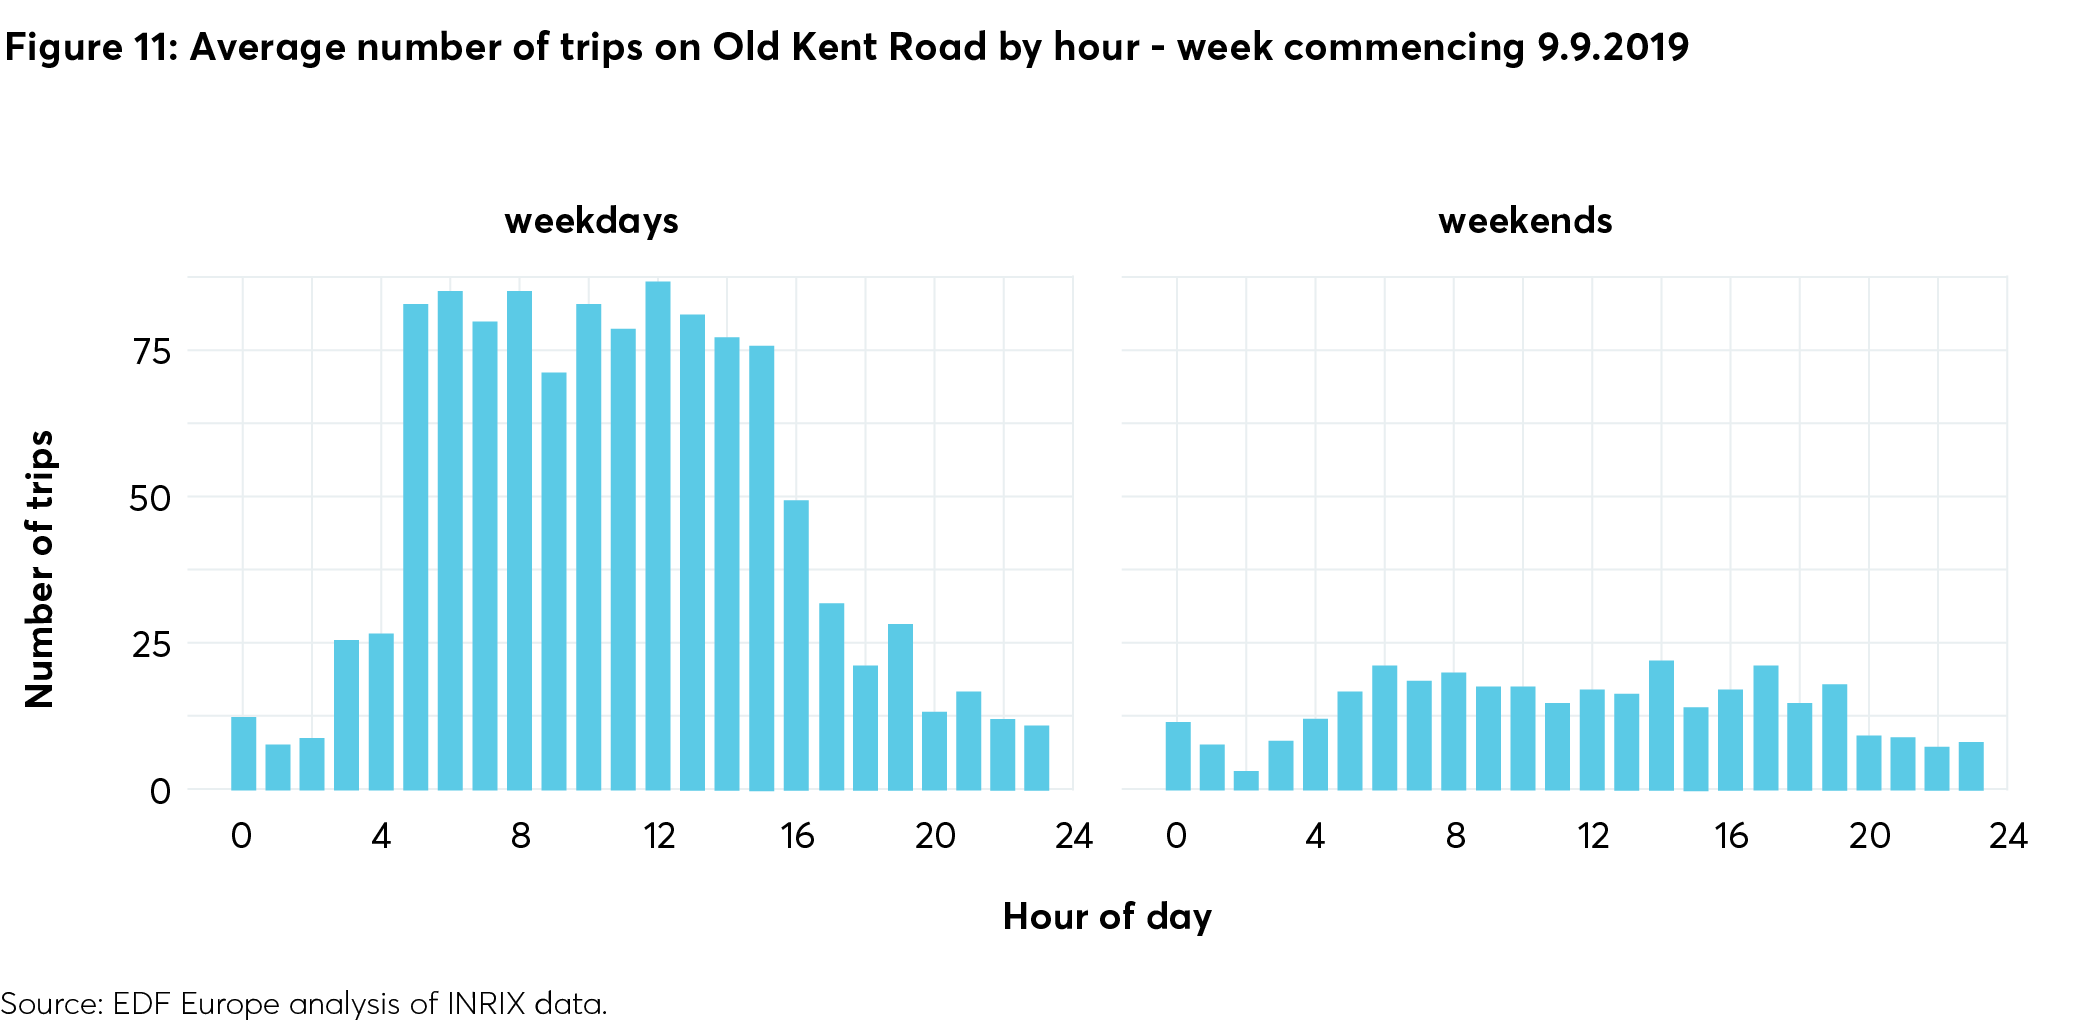
Time of journey
Vehicle journeys mostly take place on weekdays between early morning and mid-afternoon, with fewer trips in the late afternoon, evening, night time and at weekends. Local trips peak around midday, while external trips peak during the early morning rush hour. There is an opportunity to retime deliveries for later hours when there are fewer pedestrians or cyclists on the roads, in order to reduce exposure to air pollution.
The view from local businesses
We surveyed a wide range of businesses operating on or near Old Kent Road to reflect the economic diversity of the area. The businesses surveyed included restaurants, supermarkets, parcel carriers, manufacturers and retailers. While the sample size means the survey is not statistically representative, it nonetheless gives an idea of the diversity of delivery requirements, as well as the common attitudes towards the shift to low- or zero-emission freight solutions. Half of the surveys were conducted online and half in person. In-person surveys were also complemented with follow-up questions.
Sustainable commitments:
- It was fairly common for businesses to have either formal or informal sustainability targets (21 out of 30 businesses had them).
How deliveries are made:
- According to 22 out of 26 businesses, deliveries received or made tend to require extra care due to size, weight or storage requirements.
- Most businesses (24 out of 28) said they didn’t decide how deliveries were made. However, many said that they picked suppliers based on cost and reliability. In the case of chains, decisions were generally made by head office.
- Among the businesses that made deliveries to customers, many (8 out of 18) did not own any or all of the vehicles they used for deliveries.
- Many businesses making or receiving deliveries said they struggled to find space for loading or unloading – meaning they either park far away, lose time looking for a place, or receive fines.
Perceptions of solutions to reduce their air pollution impacts:
- Where businesses chose delivery times, they generally thought they already timed these to avoid congestion, or that it would not be possible for them to receive or make deliveries outside their current opening hours.
- 11 out of 30 businesses said they were already consolidating their deliveries to reduce the number of vehicle journeys. However, nearly half of businesses thought this would not be a feasible option for them.
- Nine out of 30 businesses shared some of their suppliers with other local businesses where possible. However, many businesses didn’t think this would work for them, as they thought their needs were too different from other local businesses.
- Few businesses were using electric vans to their full extent, but several were considering it or were in the process of upgrading their fleet. 21 out of 30 businesses cited cost as the main barrier, though one business expected this to change: “Transitioning to EVs is an easy decision as a lot of companies are already thinking ahead which is causing a chain reaction.” Another business said that the ULEZ expansion made the shift cost-effective, but was keen to get support for transitioning to an EV. 33
- Many businesses said they didn’t know whether cargo bikes would work for them, or said that they didn’t think them suitable or cost-effective. 12 out of 30 cited cost as the main barrier.
Key survey takeaways
Overall, businesses operating locally thought air pollution was an issue, but they didn’t necessarily see their own deliveries as having an impact on this. Few mentioned having written sustainability targets, and when they did, air pollution wasn’t mentioned. Some businesses understood that becoming more sustainable will be part of their success, because customers themselves are demanding this. However, when it came to picking suppliers or the vehicles they use for delivering goods, most business chose based on cost and, to a lesser extent, constraints as a result of the ULEZ. Some consolidation of received deliveries is underway, but this is being driven mostly by suppliers rather than businesses as customers. Establishing a Business Improvement District in the area could make it attractive for businesses to use shared suppliers at lower prices.
In terms of vehicle choice, businesses overwhelmingly didn’t own or use cargo bikes and didn’t think they would be appropriate for their needs. They also found the cost of EVs prohibitive, but would be open to adopting low-emission solutions if vehicle costs were lower. The lack of availability of on-street spaces for loading and unloading was also a key issue – creating costs for businesses and generating air pollution as vehicles circle around for loading space.
Case study: Making on-street loading more reliable
UK technology firm Grid Smarter Cities is partnering with the London Borough of Southwark to pilot a dynamic kerbside management system that will make loading and deliveries more reliable in the borough.
Many businesses rely on on-street loading to operate, but may not have a nearby loading bay for convenient deliveries. However, inconsiderate loading directly from the carriageway can create congestion and danger. The pilot includes three innovations that address this problem:
– A booking system for loading bays to make deliveries more reliable.
– Virtual loading bays that can be activated in specific circumstances (for example, if a loading bay is already in use, or to meet the delivery needs of a business).
– Dynamic e-ink smart signs that change to display the current use and booking information.
The service will be funded by the London Borough of Southwark and is expected to run for two years. Delivery firms may pay a fee to use the service, but Grid Smarter Cities believes they will find this more cost effective than the annual charge for parking tickets, and will also benefit from increased reliability of deliveries.44 If paired with rapid charging points, advance booking guarantees electric delivery vehicles a charge point en route if they need it.
In the areas where the scheme has already been rolled out, delivery firms have experienced a 21 per cent efficiency saving in their last-mile deliveries to urban areas. This is alongside a 6.6 per cent reduction in NOx emissions from all road transport, a 5.8 per cent reduction in PM2.5 emissions, and a 4.6 per cent fall in CO2 emissions, according to research by Grid Smarter Cities. Further modelling commissioned by Grid Smarter Cities and carried out by consultancy Stantec suggests that rolling out dynamic kerbside management for loading and deliveries would reduce carbon emissions equivalent to taking 13,000 cars off London’s roads. Stantec note this is equivalent to the carbon emissions reduction achieved by the introduction of the ULEZ in central London.
Crucially, dynamic kerbside management will provide local authorities with data on the demand for loading and delivery space, which can then be used to optimise kerb use. Loading bay access can be added where needed, as well as charging points for delivery vehicles, or limits on deliveries to specific times of day that allow for other uses. For instance, a restaurant might want to be able to receive deliveries safely earlier in the day before turning over the space for tables and chairs.